
Page speed optimization for SEO is one of those topics where everyone thinks they've got it figured out — until their rankings drop and their Lighthouse score still reads 94. This exact scenario plays out across sites that look perfect on paper while bleeding traffic in practice. The frustration is real, and the cause is almost always the same: the audit was measuring the wrong thing.
Over 90% of all indexed web pages receive zero organic traffic from Google, according to Ahrefs' landmark study. Speed isn't the only reason — but for pages that are already competitive, a slow real-world experience is often the invisible ceiling holding them back. The problem is that most SEOs are optimizing for synthetic lab scores instead of the field data that Google actually uses to rank pages.
Here's what most audits completely miss — and what I've found the data actually shows.
Q: Why does page speed optimization for SEO fail despite great Lighthouse scores?
That's the question that comes up more than any other in my work — and most people get this completely wrong.
Lighthouse is a lab tool. It runs in a controlled environment, on a single simulated device, with a throttled connection, at one moment in time. It tells you what could happen under ideal conditions. The Chrome User Experience Report (CrUX), on the other hand, collects real field data from actual Chrome users visiting your site — their devices, their connections, their geography, their browser state. These two datasets can tell wildly different stories about the same URL.
In my audits, I've surfaced sites where Lighthouse returned a 91 performance score while CrUX data showed that 38% of real users were experiencing "Poor" LCP — meaning their largest content element took more than 4 seconds to load. Google's ranking systems use the field data, not the lab score. So that 91 is essentially a vanity metric if the CrUX distribution is red.
The fix is simple but underused: open Google Search Console, navigate to the Core Web Vitals report, and look at the URL-level field data. Then cross-reference with PageSpeed Insights, which shows both lab and field data side by side. If field data shows "Needs Improvement" or "Poor" while the lab score looks fine, there is a real-world performance problem that no amount of Lighthouse chasing will solve.
Q: Core Web Vitals ranking impact: Which metrics actually move rankings?
Not all three Core Web Vitals carry equal weight — and the ranking signal correlation data from the past 18 months makes this pretty clear to me.
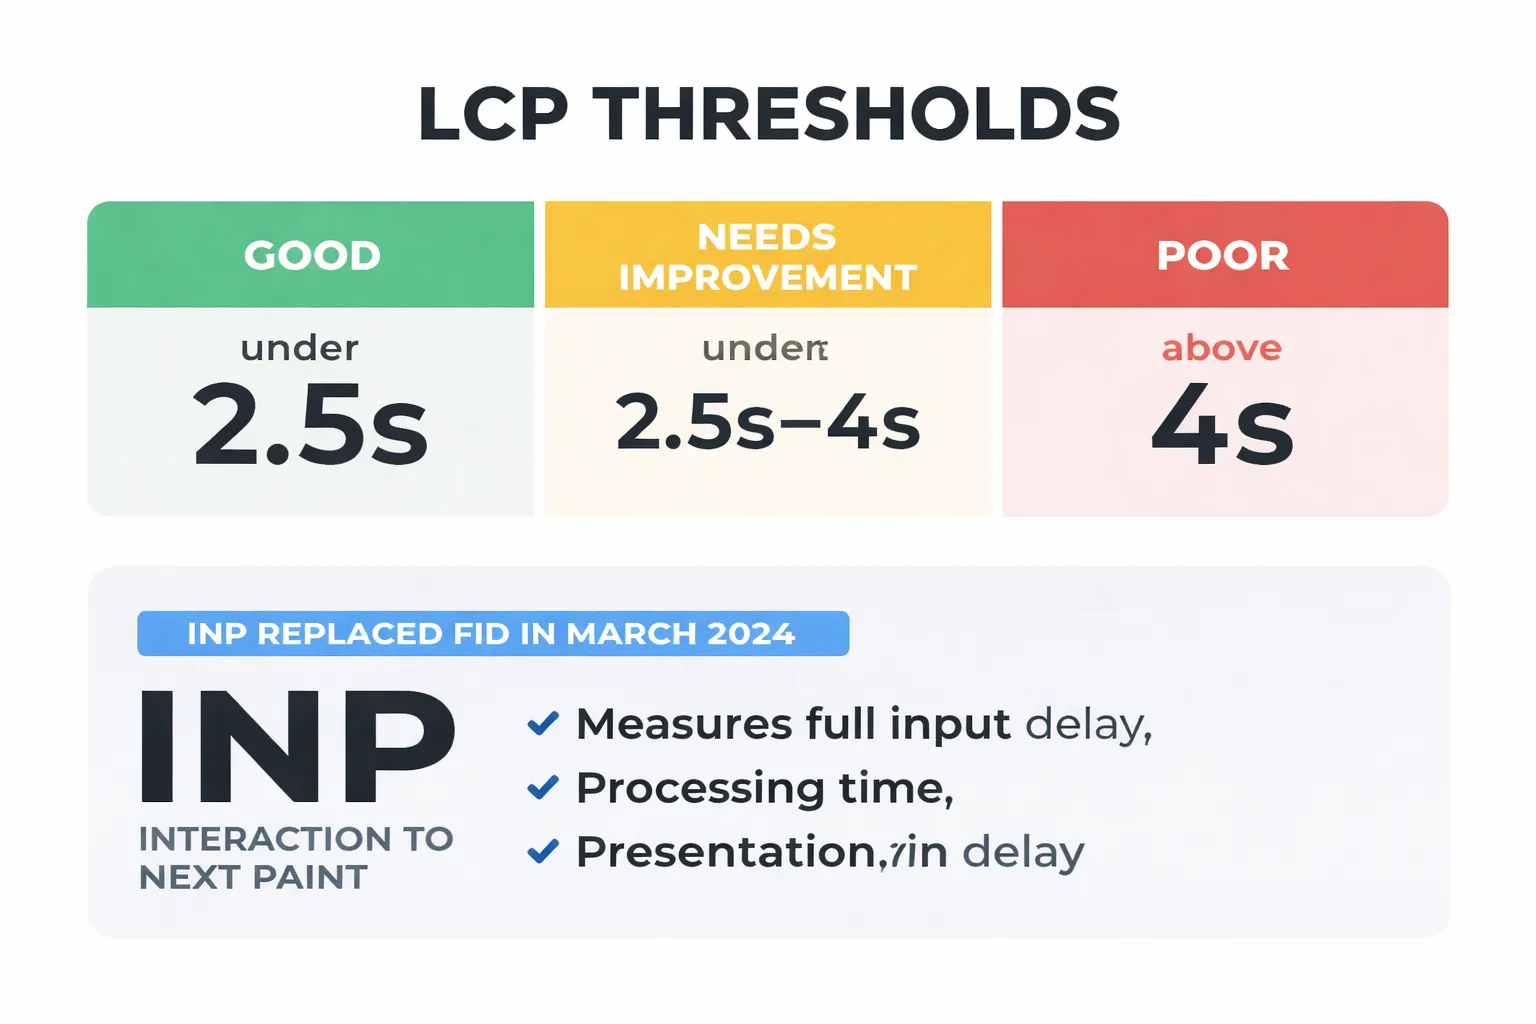
INP (Interaction to Next Paint) is the metric I recommend watching most closely right now. Google replaced FID with INP as an official Core Web Vital in March 2024, and the early correlation data suggests it has a stronger relationship with ranking changes than FID ever did. INP measures the full input delay, processing time, and presentation delay for every interaction on a page — not just the first one. Sites with heavy JavaScript frameworks, chatbots, cookie consent managers, and third-party tag stacks are getting hammered by this metric in ways they don't even realize yet.
LCP (Largest Contentful Paint) remains the most impactful metric for initial ranking signal purposes. The threshold is clear: under 2.5 seconds is "Good," 2.5–4 seconds is "Needs Improvement," and above 4 seconds is "Poor." In my experience, the jump from "Needs Improvement" to "Good" produces measurable ranking movement on competitive queries, while the jump from 1.8 seconds to 1.2 seconds produces almost nothing. There are genuine diminishing returns here, and most technical SEO audits don't acknowledge them.
CLS (Cumulative Layout Shift) is the most misunderstood. A score of 0.1 or below is "Good," but I've seen sites frequently obsess over getting from 0.08 to 0.02 while their INP sits at 380ms. That's the wrong priority. CLS matters most on ad-heavy pages, pages with lazy-loaded images without explicit dimensions, and pages with dynamically injected content above the fold.
My recommended ranking signal hierarchy: INP first, LCP second, CLS third. Optimize in that order unless LCP is above 4 seconds — then LCP jumps to the top.
According to Google's February 2026 Discover Core Update documentation, page experience signals — including Core Web Vitals — continue to factor into content surfacing decisions across both Search and Discover. The update reinforced that field data from real users is the authoritative signal, not synthetic benchmarks.
Q: What are the fastest technical SEO page speed fixes that actually move the needle?
The following five fixes are ranked by impact-to-effort ratio, drawn from my repeated application across site audits. Each one takes under two hours with the right approach.
1. Convert images to WebP or AVIF format This is still the single highest-ROI fix on most sites I audit. AVIF delivers 40–50% smaller file sizes than JPEG at equivalent quality. On WordPress, ShortPixel or Imagify handle bulk conversion automatically. On a custom stack, a build-step conversion via Sharp or Squoosh CLI gets this done in one deployment. The LCP improvement on image-heavy pages is often immediate and significant.
2. Defer render-blocking scripts
Open the PageSpeed Insights report and look at the "Eliminate render-blocking resources" opportunity. Any script that isn't critical to above-the-fold rendering should carry a defer or async attribute. The most common offenders I encounter: Google Tag Manager loaded synchronously in the <head>, third-party chat widgets, and A/B testing scripts that fire before the DOM is ready. Moving GTM to load after the DOMContentLoaded event alone can drop LCP by 300–600ms on mid-tier hosting.
3. Preload your primary web font
Font loading is a silent LCP killer. If a hero section uses a custom font and it's not preloaded, the browser has to discover it, request it, download it, and then render text — all before LCP can register. Add a <link rel="preload" as="font"> tag for the primary font file in the <head>. Use font-display: swap as a fallback. This is a 15-minute fix with measurable impact.
4. Audit and remove unnecessary third-party tags This is where most marketing stacks create compounding problems. In my work leading content strategy at Meev, I've seen sites carrying 14 active third-party tags — retargeting pixels, heatmap tools, affiliate trackers, abandoned cart scripts — where half of them haven't fired a meaningful event in six months. Every tag adds network requests, JavaScript execution time, and INP risk. Run a tag audit in Google Tag Manager, pull the firing frequency data, and remove anything that isn't actively contributing to revenue. The INP improvement from removing two or three heavy tags can be dramatic.
5. Configure your CDN correctly A CDN isn't just "turn it on and forget it." I've worked with sites running Cloudflare with cache TTLs set to 2 hours on static assets that never change, meaning users in Singapore are hitting the origin server in Virginia on every visit. Set cache TTLs for images, CSS, and JS to at least 30 days. Enable Brotli compression (it's 15–20% better than gzip on text assets). And for sites serving a global audience, check CDN edge node coverage against actual user geography in Google Analytics — CDN latency can vary significantly by region in ways that matter for real-world performance.
Q: Does page speed affect how AI bots crawl and index content?
This is the most underreported issue in technical SEO right now — and I'll be direct: yes, slow pages get crawled less frequently, and that has compounding consequences in the current search environment.
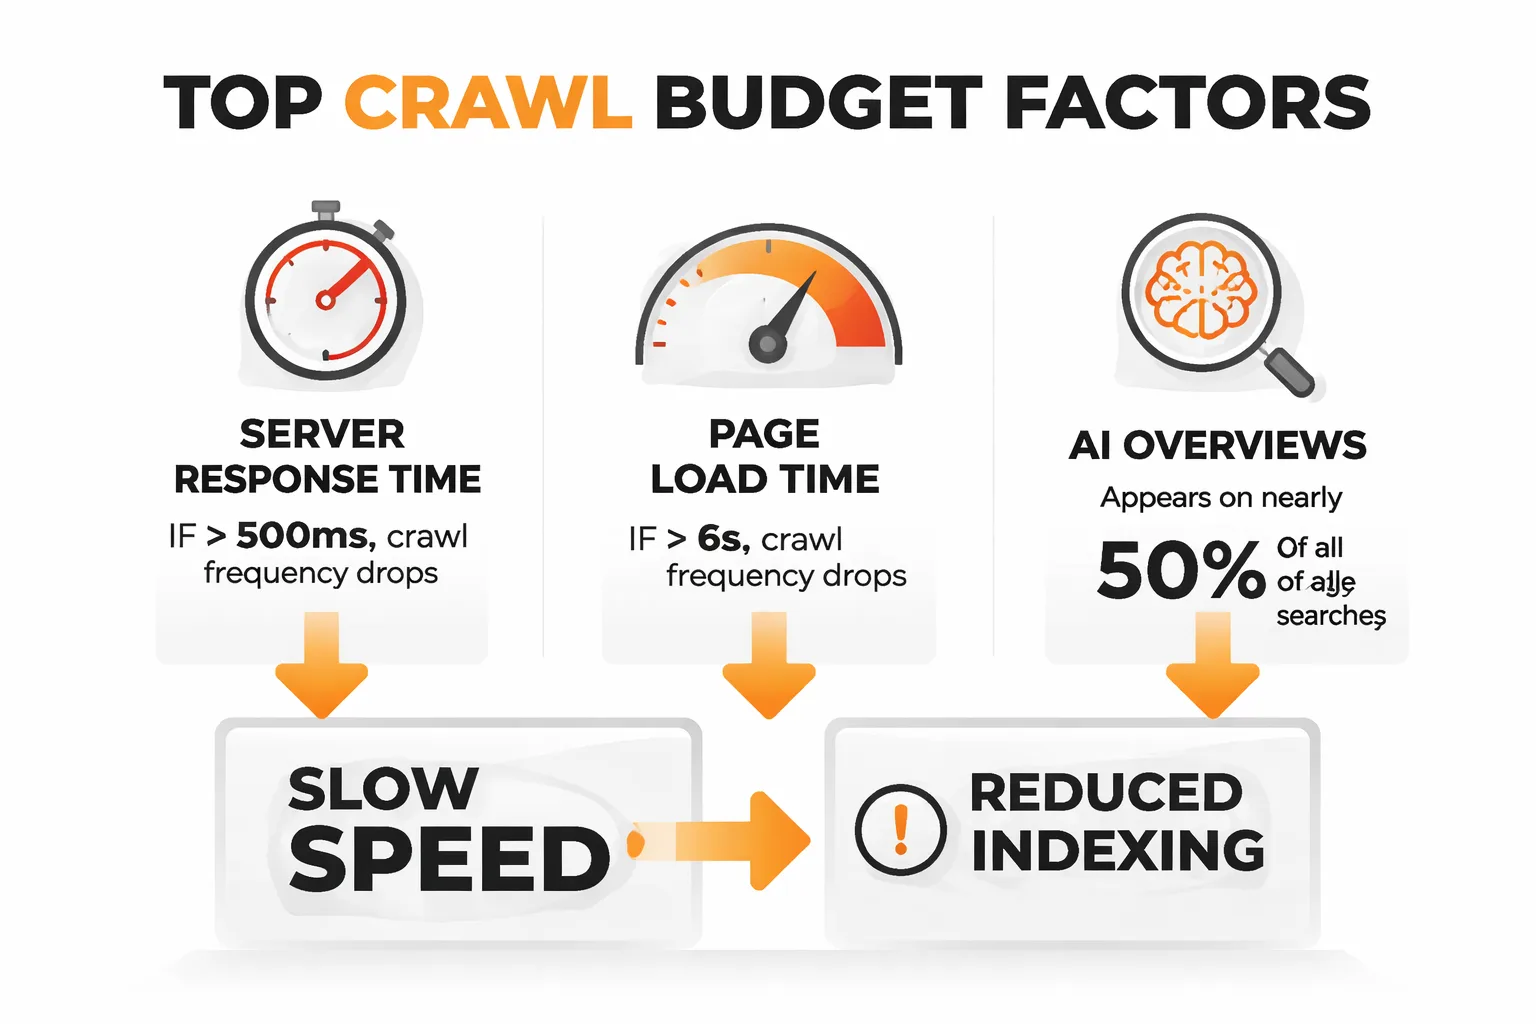
Googlebot operates on a crawl budget — a combination of crawl rate limit (how fast a server can respond without being overwhelmed) and crawl demand (how much Google wants to crawl the content). When server response times are consistently above 500ms, or when pages take 6+ seconds to fully load, Googlebot reduces its crawl frequency. For large sites, this means new content and updates take longer to index. For smaller sites, it means pages that should be ranking aren't even fully processed yet.
But here's the part that connects directly to GEO performance — the visibility of content in AI-generated answers and AI Overviews. AI Overviews now appear on nearly half of all Google searches, which means the content Google chooses to surface in those answers is increasingly important. If pages are slow to crawl and slow to update in Google's index, there is a structural disadvantage for AI Overview inclusion. The AI systems pulling content for these answers rely on Google's freshness signals, and freshness is directly tied to crawl frequency.
I've also noticed an underreported pattern — sites blocking certain AI crawlers via robots.txt (the Google-Extended blocking debate is real and ongoing) while simultaneously having slow load times are creating a double visibility problem. They're reducing crawl access AND making the content that does get crawled harder to process efficiently. For sites thinking about content visibility in AI-driven search results, page speed is no longer just a ranking factor — it's a content accessibility factor.
This connects directly to a broader point covered in the piece on how to write for AI Overviews without losing your audience — the technical accessibility of content is just as important as its structure and clarity when it comes to AI citation.
Q: How do you set up a monitoring workflow that catches regressions early?
Most teams fix speed issues reactively — they notice a ranking drop, run an audit, find the regression, fix it. By then, the damage is done. The proactive workflow I recommend is built entirely on free tools.
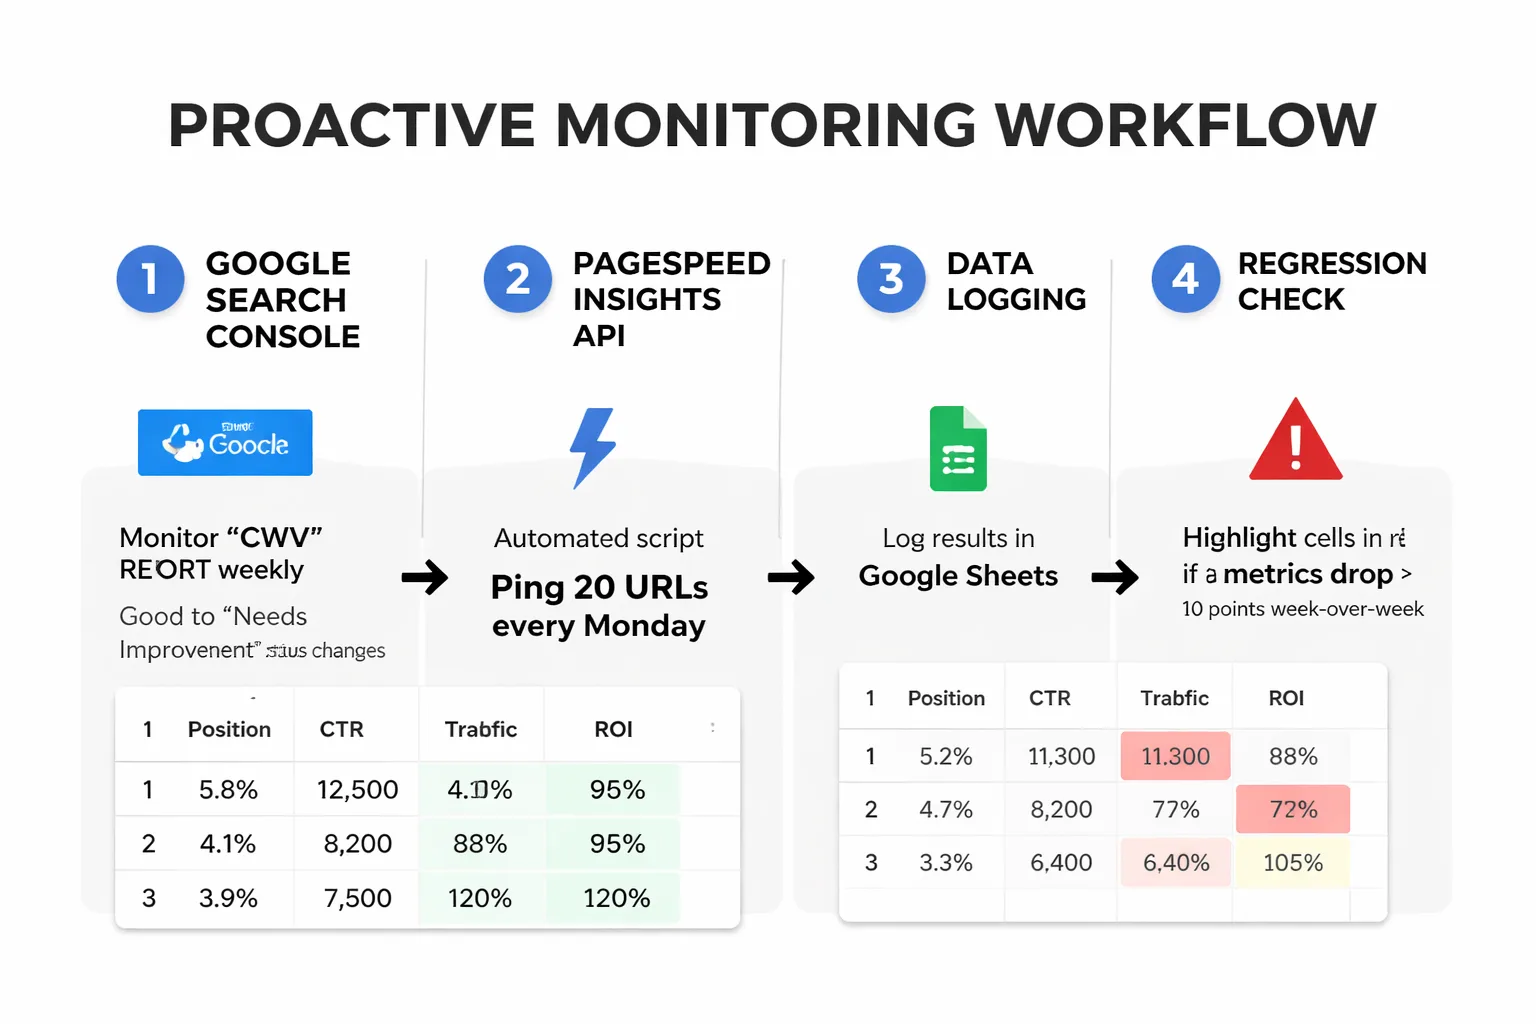
Step 1: Set up Core Web Vitals monitoring in Google Search Console. The CWV report in GSC will flag URLs that move from "Good" to "Needs Improvement" or "Poor" status. I recommend checking this report weekly, not monthly. Set a calendar reminder. When a URL group shows degradation, that's the early warning signal.
Step 2: Use the PageSpeed Insights API for automated scoring. The PSI API is free and lets you programmatically pull both lab and field data for any URL. I've set up a simple Google Sheets script that pings the API for the top 20 URLs every Monday morning and logs the results. If any metric drops more than 10 points week-over-week, the cell highlights in red. This takes about 90 minutes to set up and has caught major regressions before they hit rankings — including cases caused by new chat widgets installed without notifying the SEO team.
Step 3: Configure a free uptime and performance alert. Tools like UptimeRobot (free tier) or Better Uptime send alerts when server response time exceeds a threshold. I set the alert at 800ms for TTFB — this catches hosting issues, traffic spikes, and plugin conflicts before they compound into CWV problems.
Step 4: Tag every deployment. This sounds obvious but almost nobody does it. Every time a code update is pushed, a plugin is installed, or a new marketing tag is added, log it with a timestamp. When a performance regression appears in monitoring data, it needs to correlate with a change. Without a deployment log, debugging is essentially blind.
For sites using Google Search Console structured data alongside speed monitoring, the 7 critical SEO mistakes to avoid in 2026 resource is worth a read — it covers several technical regression patterns that have become more common as sites scale their automation and AI content creation workflows.
Rapid-Fire Round
Does a perfect 100 Lighthouse score guarantee better rankings? Absolutely not. A 100 in lab conditions with poor CrUX field data is meaningless for ranking purposes. In my experience, a 78 with clean field data outperforms a 100 with red CrUX metrics every single time.
How much does page speed actually matter compared to content quality? For most queries, content relevance and authority still outweigh speed. But speed is the floor — if a site is below the "Good" threshold in field data, it's giving up ground to competitors who aren't. Think of it as table stakes, not a differentiator.
Is mobile speed more important than desktop? Yes, and by a significant margin. Google indexes the mobile version of a site first, and CrUX data skews heavily toward mobile users. When I'm advising teams on where to focus optimization effort, mobile wins every time.
What's the one speed metric most teams completely ignore? INP. It's the newest Core Web Vital, it's the hardest to measure without real user monitoring, and it's the one I expect to cause the most ranking surprises in 2025 and 2026. If INP hasn't been audited in field data yet, that's where I'd start.